Keynote Speakers
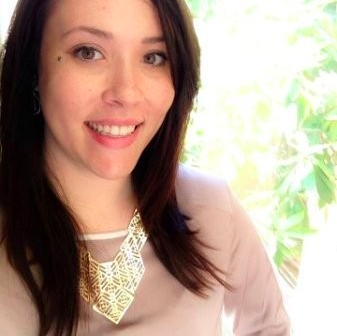
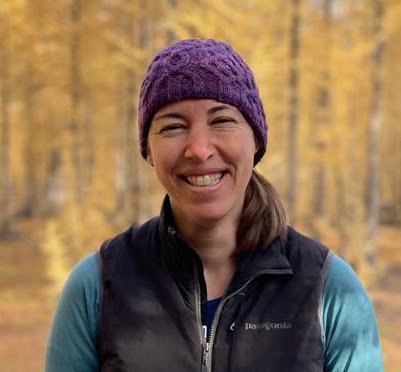
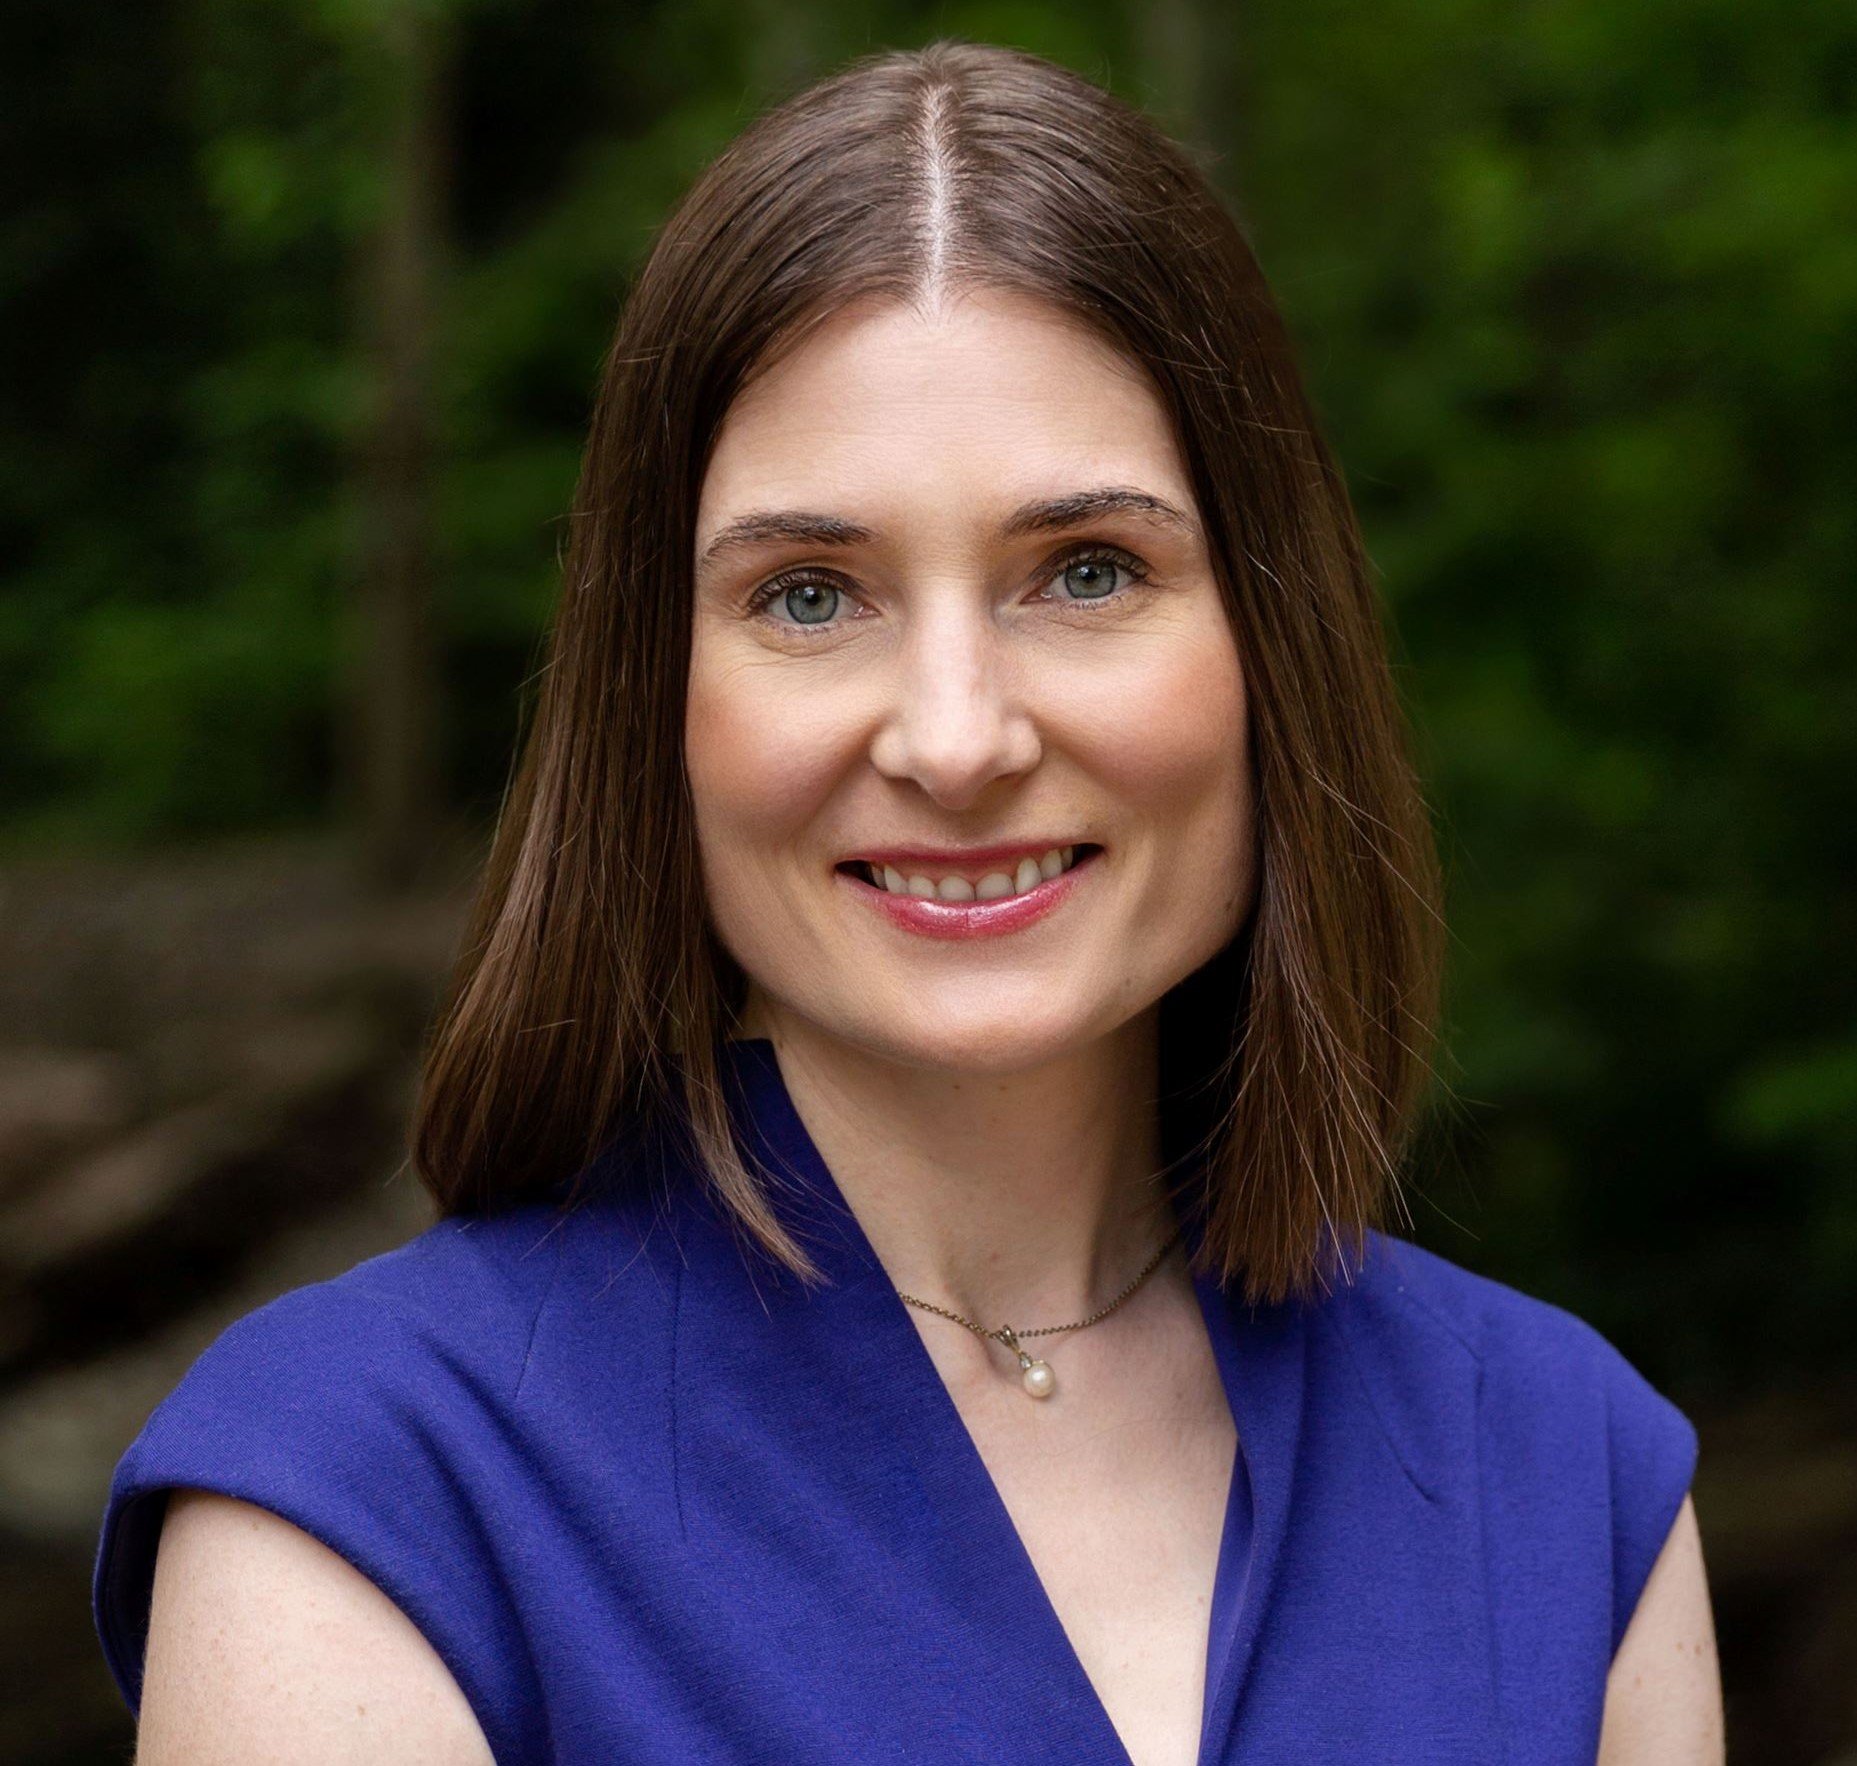
Heather Harris
FIELD CHIEF DATA & ANALYTICS OFFICER - ALTERYX
Heather Harris is the Field Chief Data & Analytics Officer for Alteryx with deep experience leading and delivering data science, advanced analytics, and data technology solutions for some of the world's best-known brands. Heather began her career as an electrical and computer engineer designing supercomputer and networking computer chips in Silicon Valley. She pivoted mid-career into data and advanced analytics through graduate studies in data science and information management. When she’s not working, Heather enjoys adventure travels and Kraken hockey games with her teenage son, as well as hiking, cross-country skiing, backpacking, kayaking and scuba diving.
What We Can Learn from Doors to Improve Data Science Outcomes
morning KEYNOTE - heather harris
Data Science is an inherently creative endeavor where data scientists strive to make a meaningful impact with their findings. Heather will discuss how the same principles used to design a good door can ensure delivery of high-quality, high-impact data science solutions. Through application of design methods, design thinking and a human-centered, product mindset, you can increase the impact and value of data science investments.
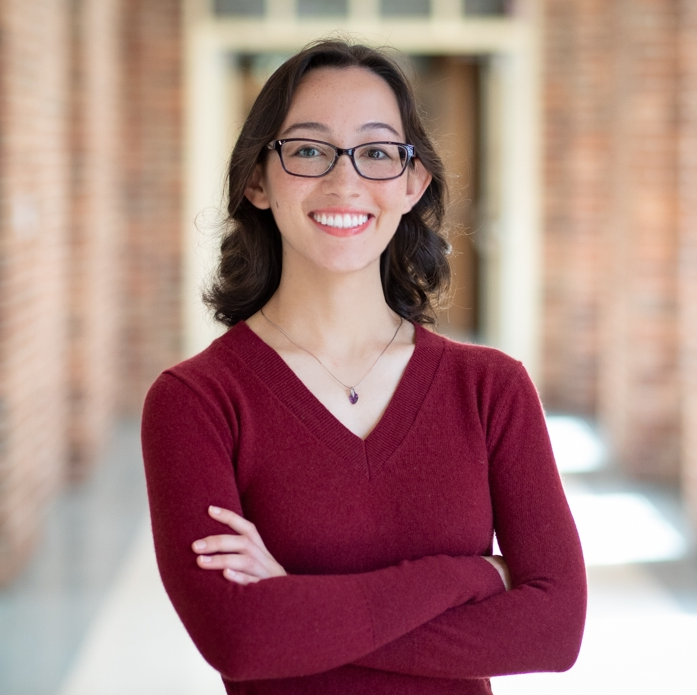
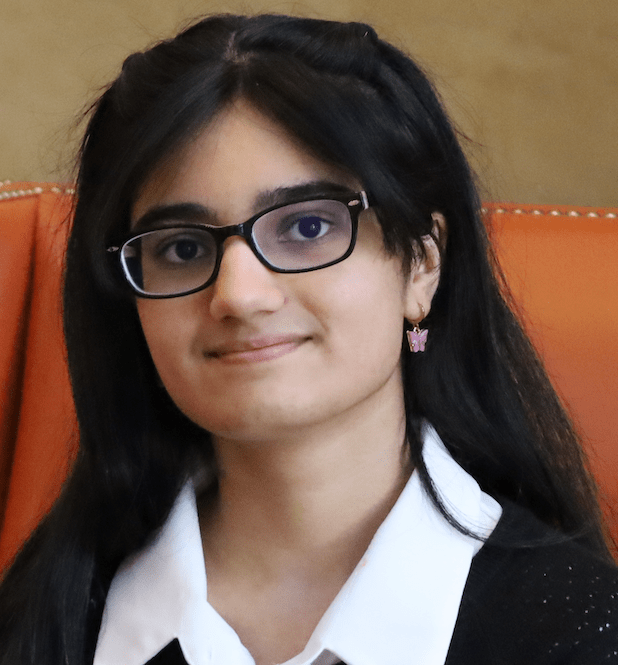
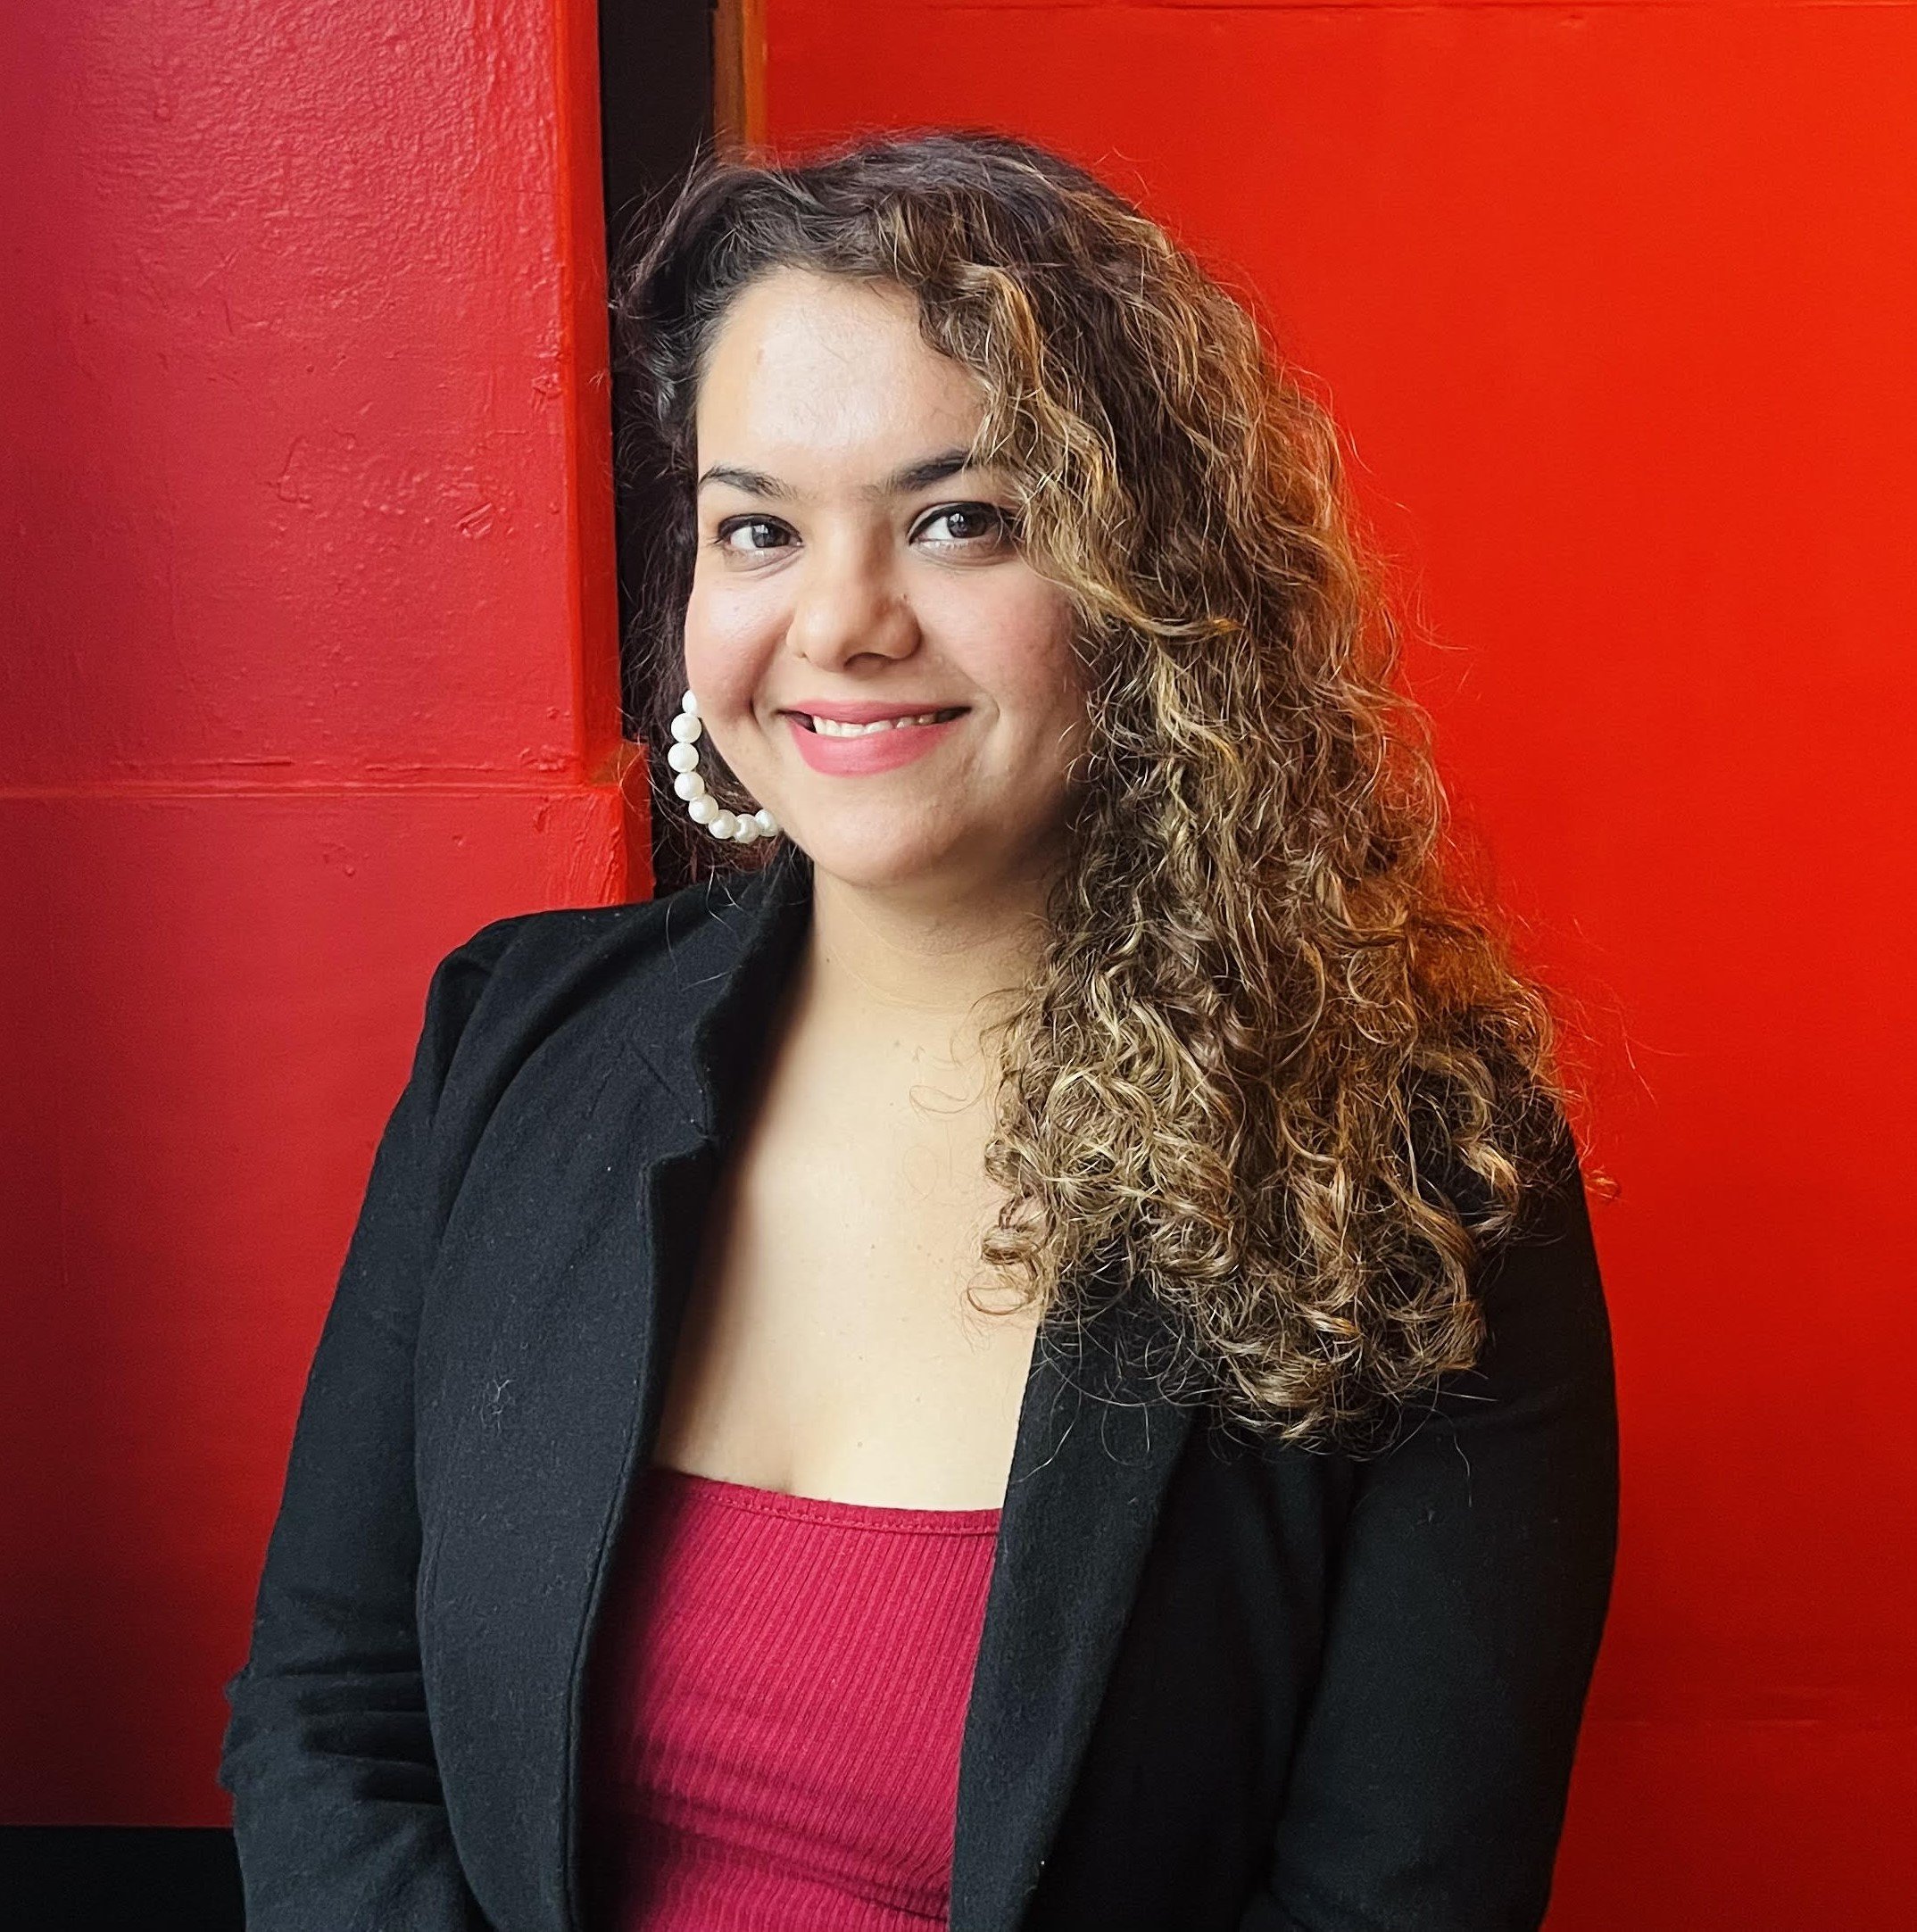
Sundas Khalid
principal analytics lead - google
Sundas Khalid is a Principal Analytical Lead at Google with vast experience in search engine and ecommerce. Prior to Google, Sundas was at Amazon where she led large-scale experimentation and data science initiatives and won multiple awards for her work. Outside of work, Sundas has built a brand and strong presence in the data science community through educational content that helps others lead a successful career. As the first-female in her family to graduate university, she is an advocate of women's education and workforce diversity. In 2021, Sundas helped women of color negotiate $1.4M in job offers. Sundas' journey is one of persistence and resilience, and has been featured on Forbes.
Transform into a Data Science "Unicorn"
afternoon keynote - sundas Khalid
Do you ever wonder what it takes to stand out in the data science space? Data Science is an ever evolving space and continues to gain popularity by the media, job seekers, hiring managers and organizations. In this talk, we will discuss how you can position yourself to stand out in the ever-growing space and transform into a data science ‘unicorn.” By the end of this session, you will gain clarity and next steps to establish and keep growing your brand in the data science field at your work and beyond.
Breakout Sessions
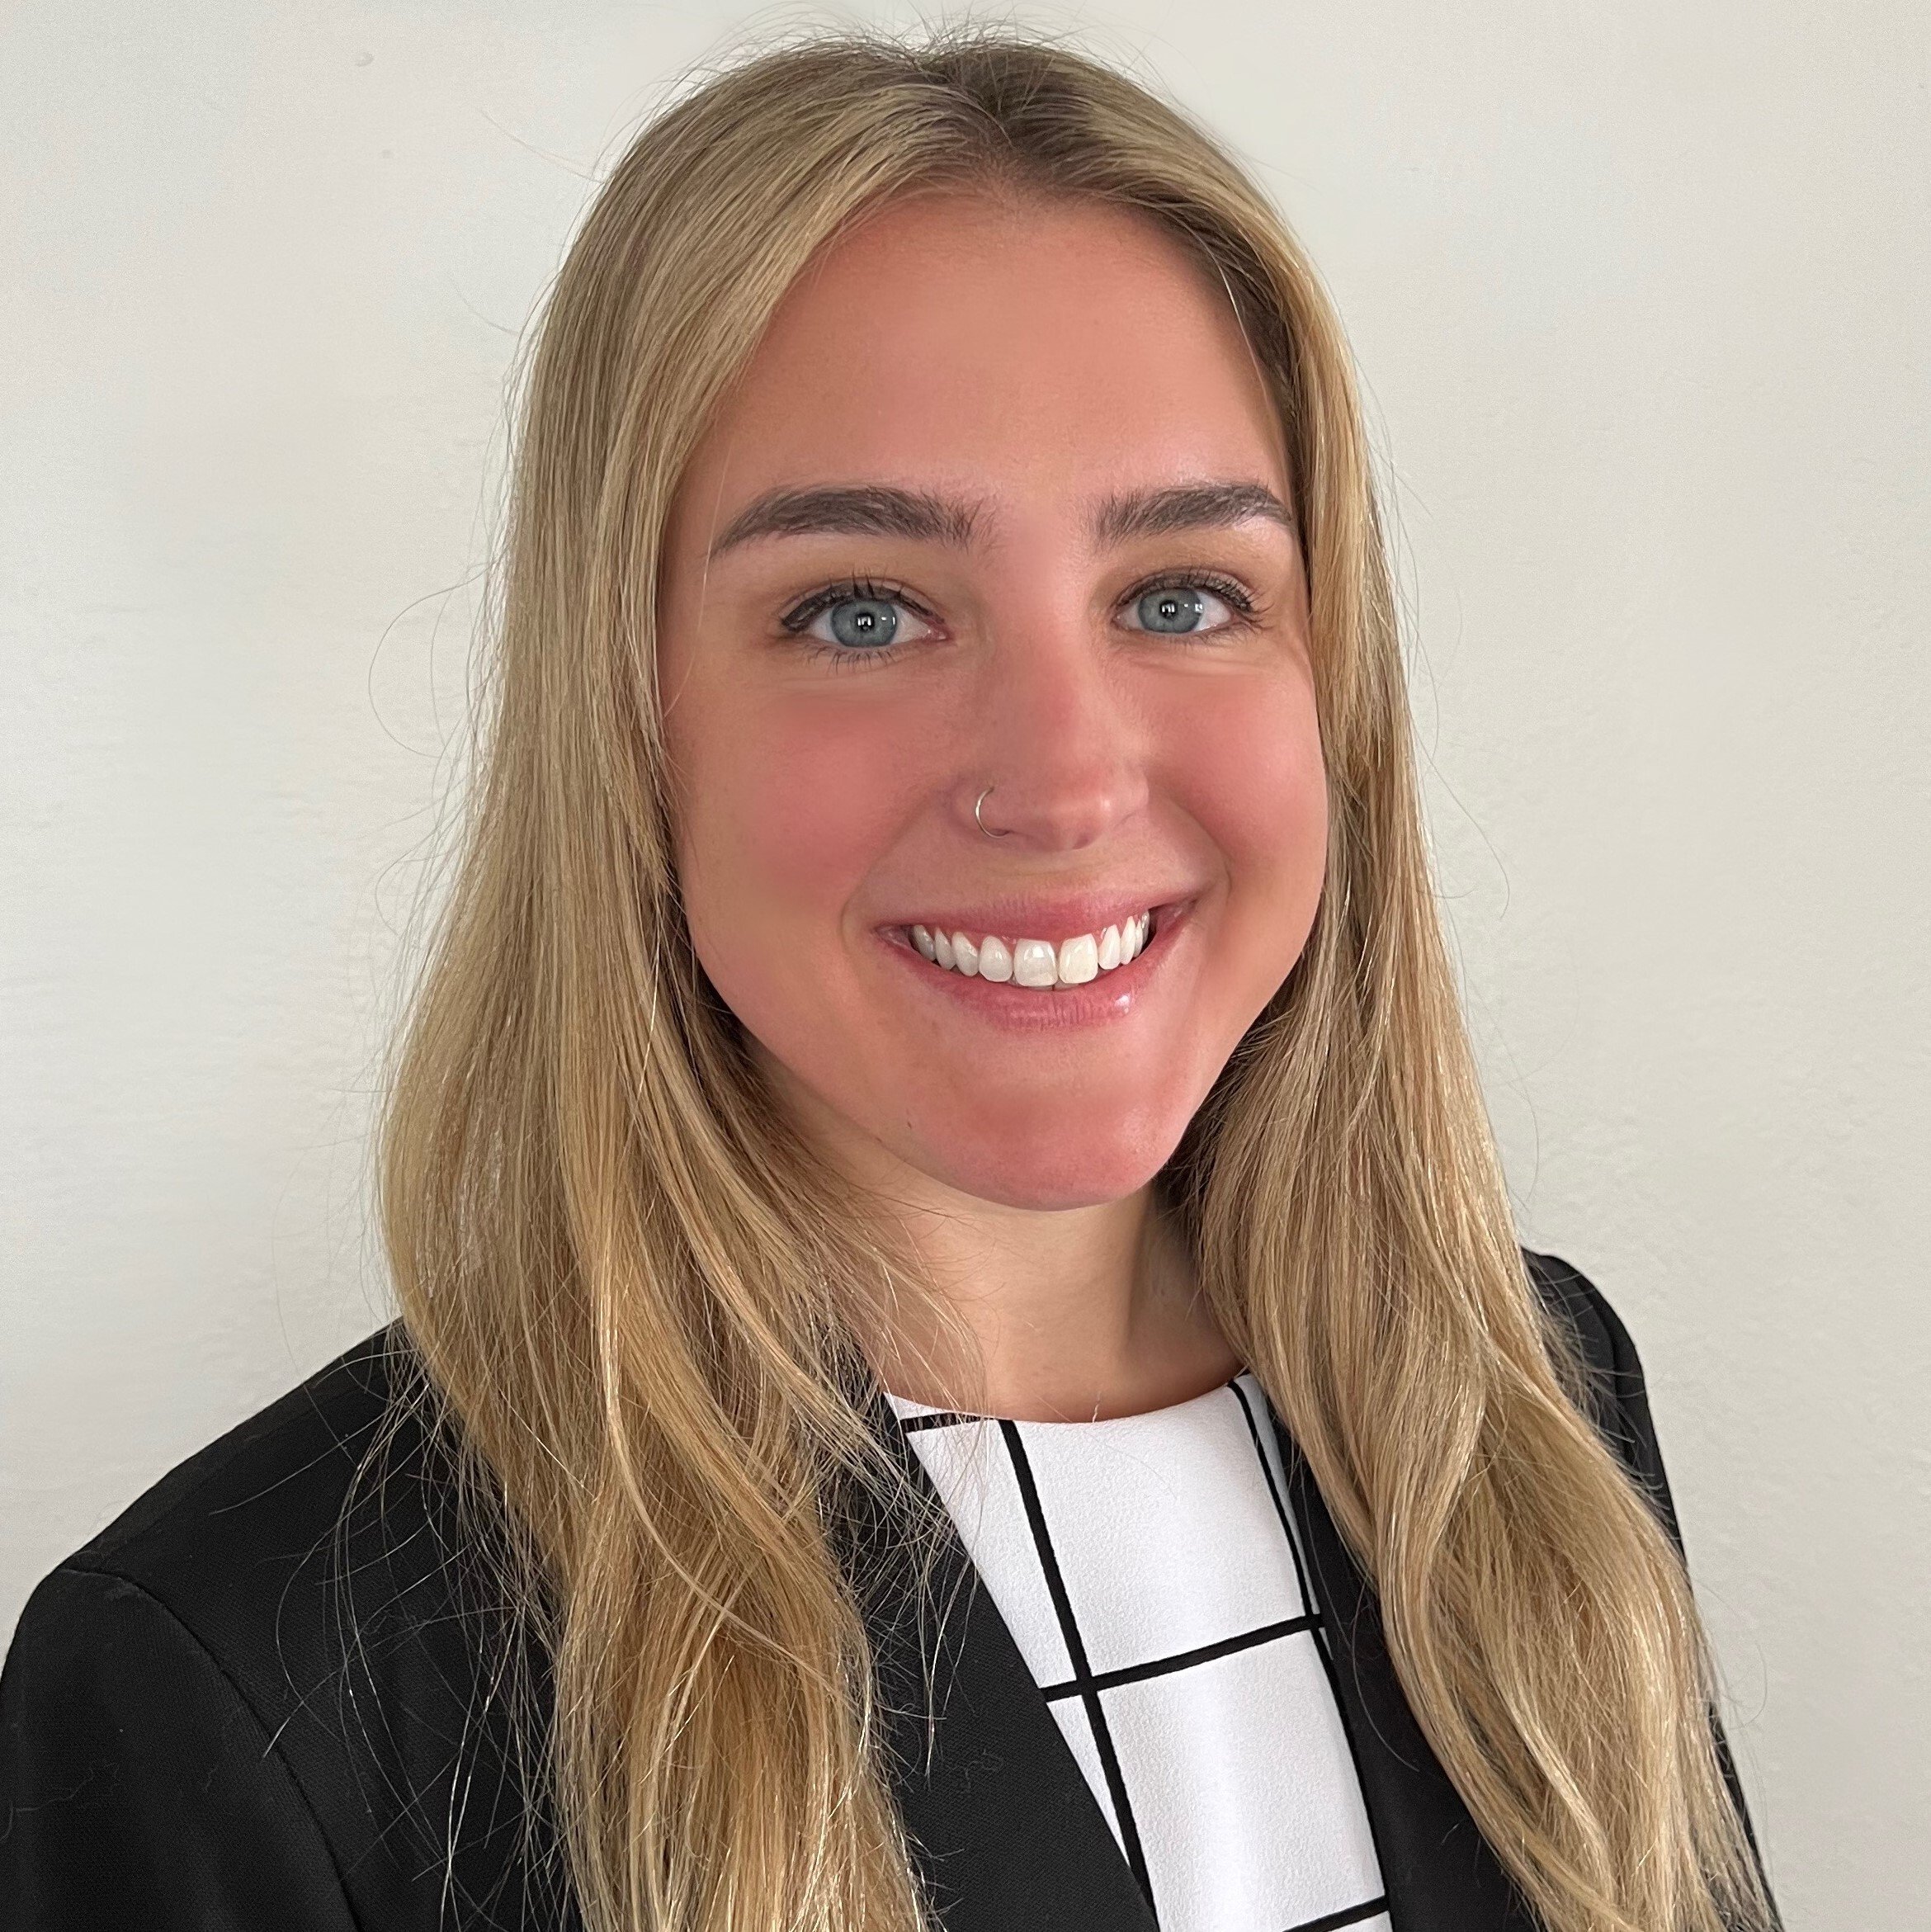
C. Merrell Stone
HUMAN SYSTEMS RESEARCH LEAD - Avanade
C. Merrell Stone leads human-systems research for the Emerging Technologies team at Avanade. She focuses on several areas of new technology including immersive experiences and conversational AI which she explores through a mixed-methods approach leveraging human factors research, innovation tools and processes, and strategic foresight.
How to Make Things Simpler by Adding Complexity
Session - C.MERRELL STONE
Using “big data” is no longer sufficient. As we’ve become more competent with leveraging data at scale, we find ourselves digging deeper into understanding not just the data, but also the interrelationships between all those data. This is the essence of what is called, by some, “graph thinking” – using network science to map out data into different nodes, edges, even different layers of interconnected graphs (hypergraphs). This talk will explore how adding one more element, complexity science, can actually simplify decision making at multiple levels of an organization. Building on Dave Snowden’s Cynefin model of decision making, I’ll discuss how tools like agent-based modeling can make our models less-wrong, as well as endow us with some of the same powers of machine learning.
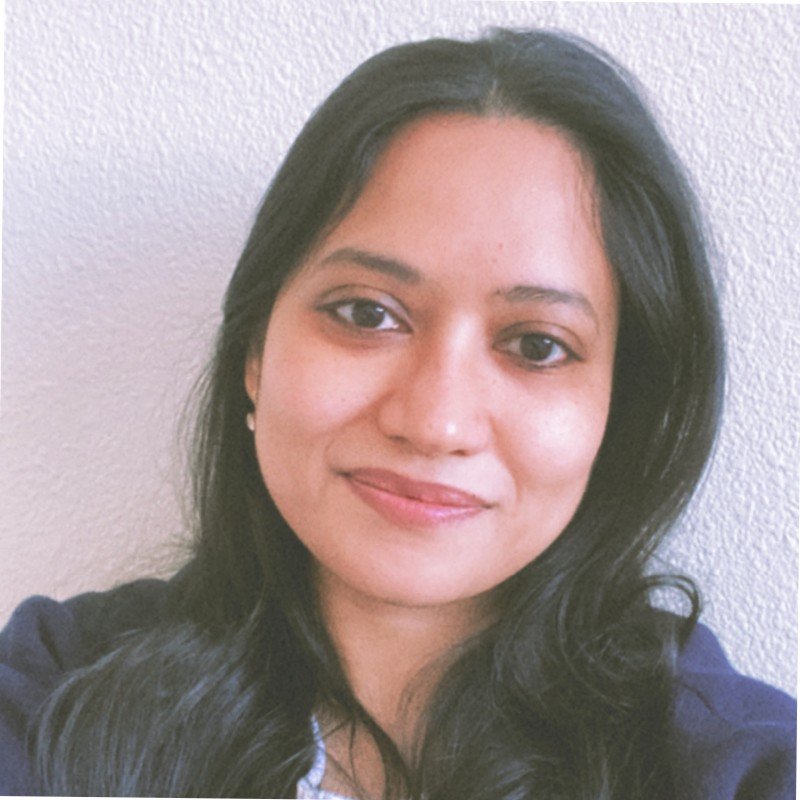
Diana Wolfe
Principal Applied Researcher for Emerging Technologies - Avanade
Diana Wolfe is a doctoral candidate at Seattle Pacific University for Industrial-Organizational Psychology. She has leveraged her understanding of psychology and data sciences to inform her research with Avanade on the subject of emerging technologies. She is the founding member of several social justice-based research collectives: ethicaXmachina and The Social Justice League. Her areas of interest are psychological safety, digital ethics, decolonizing data sciences, and transformational leadership.
Leveraging Probabilistic Thinking in the Age of Quantum Computing
Session - DIANA WOLFE
As we navigate the rapidly evolving landscape of the digital age, we find ourselves facing a plethora of uncertainties. But as with any great scientific exploration, these uncertain times present opportunities for growth and adaptation. In a world where data is king, the ability to reason about uncertainty and make decisions based on incomplete or uncertain information is becoming more crucial than ever. And at the forefront of this endeavor is probabilistic thinking, a key component of approaches in machine learning and artificial intelligence. Now, with the advent of quantum computing, the field of data sciences is on the brink of a new frontier. To fully capitalize on the power of quantum computing, we must adopt a probabilistic mindset and understand the unique characteristics of quantum computing and its impact on the field of data sciences.
Sarah Shy
DATA SCIENTIST - MICROSOFT
Sarah is a data scientist at Microsoft where she works on applications of causal inference and builds ML models to power intelligent Windows features. Sarah enjoys mentoring newcomers to data science. Before joining Microsoft, Sarah was a semi-professional violinist.
Towards Scalable Causal Inference
Session - Sarah SHY
Causal inference has received increased attention over the past several years as we transition from correlational hypotheses to causal hypotheses. This applies to many industries where we aim to quantify the causal impact of a treatment — an intervention, marketing campaign, policy, or new feature — on a desired outcome, such as health, sales, or end-user experience. This talk will introduce the underlying need for causal inference methods and provide a high-level overview of state-of-the-art causal inference techniques. Finally, we will discuss the challenge of performing causal inference with large-scale data and introduce a Spark-based open-source contribution that brings us one step closer toward high-performance, scalable causal inference.
Anushna Prakash
ECONOMIC DATA ANALYST - ZILLOW GROUP
Anushna is an economic data analyst at Zillow where she writes data-focused articles about the housing market. She completed her M.S. in Data Science at the University of Washington in 2022. She enjoys developing new methods and metrics to answer broad questions about the housing market.
Why some homes sell quickly and others linger: a survival analysis of listings in the pandemic housing market
Session - ANUShna prakash
The pandemic saw some of the hottest for-sale market conditions on record, which abruptly cooled in 2022 as mortgage rates rose and reached new highs. In the span of a year, buyers and sellers went from a market in which homes went pending in less than a week to a month or more. The slowdown did not affect all homes equally. While on average homes were spending longer on the market (measured by median days on market), prior research found that there exists a subset of homes that continue to go under contract rapidly. We use survival analysis techniques (known as event history analysis or duration models) to identify the different factors that influence the time to sell a home across metropolitan areas in the U.S., including home characteristics as explanatory variables such as bedrooms, bathrooms, square footage, the age of the home. A survival-analysis approach allows us to use information about the time a property stays on market before going to pending – including if it has yet to go pending– to measure the relative importance of various factors. Preliminary results suggest that the median duration to pending has changed year over year, and that employing our approach tells a more nuanced story than looking at other more commonly-used metrics, such as median days to pending.
Frederike Dubeau
Manager, advanced analytics - logic20/20
How Data Science is Changing the Utilities Industry
Session - Frederike Dubeau
Change is underway for utilities in the United States. Energy consumption is increasing, technology is evolving, and infrastructure investment is disrupting the status quo—all as the global community pushes to achieve net zero carbon emissions by 2050. Utilities and their customers are working together to meet this goal. Using machine learning, digestible visuals, and cloud processing, utilities can predict and improve outcomes, whether in vegetation management, transmission and distribution, field service, or customer service. Demand response programs enable customers to reduce their electricity consumption, optimizing usage to meet needs more effectively. Whether it’s out in the field, over the phone, or up in the cloud, utilities can leverage existing investments and new discoveries to power a brighter future. Logic20/20 is involved in many different analytics projects in this space specifically with Southern California Utilities. This talk will cover the specific challenges Utilities face and how Logic20/20 has gotten involved and what other work we believe will be important to tackle in the upcoming years in this space.
Faraz Rahman
DATA SCIENTIST/STUDENT - Carnegie Mellon University-Silicon Valley
Faraz is a seasoned analytics professional with over ten years of experience in applying analytical, data science, and programming knowledge in core engineering fields such as Manufacturing, Defense, Renewable Energy, Education, Precision Agriculture, and Remote Sensing Technology. Faraz is skilled at identifying business pain points and providing analytics solutions to customers and is passionate about applying data science for social good.
Access and Retrieve DNA Sequencing Data Using Python for Analysis
Session - FARaz rahman
We are all aware that data science, machine learning, and artificial intelligence are some of the most innovative and emerging fields of the 21st century, and that these fields will continue to be significant as long as there is trustworthy data available for analysis and application. However, it is not always simple to access data, and data scientists are frequently stymied by complex external APIs. This is due to a number of factors, the most prominent of which is that the focus of most data science courses is more on building complex machine learning and AI algorithms and less on identifying and retrieving data from credible sources that are accessible via various open source APIs. Bringing domain expertise into play further complicates the situation. The rules of data science in the real world differ from what is taught in online courses, and it goes without saying that employers are now seeking data scientists or data professionals who can collaborate with software engineers to write scalable and reproducible code in addition to building complex machine learning models. To address this issue, my proposal is to walk the audience through a data engineering pipeline that will allow them to easily access and retrieve DNA sequencing data from National Center for Biotechnology Information (NCBI’s) open source Sequence Read Archive (SRA) database and parse them in python for subsequent use in analytics. DNA sequencing is useful in numerous fields, such as determining ancestry, diagnosing possible diseases, and identifying new Covid variants. As an illustration, I will demonstrate how to retrieve SARS-CoV-2 sequencing data from NCBI's sequencing database and evaluate its quality. Audience members will be able to comprehend the specifics of sequencing data and acquire a solid understanding of Biotechnology data parsing and its application. It will give our audience the ability and confidence to retrieve and analyze their data which they can replicate in any field they want to and build a portfolio of meaningful projects to showcase their skills to the employers.
Anjali Aggarwal, PhD
Data Scientist - seagen
Anjali is a data scientist at Seagen, a biotech pharma company dedicated to discovering, developing and commercializing transformative cancer medicines to make a meaningful difference in people's lives. At Seagen, Anjali is focused in developing end-to-end machine and deep learning capabilities for cancer therapeutics with the goal of bringing these therapies to patients faster. Prior to joining Seagen, Anjali worked as a python developer at Fred Hutch, building data pipelines for HIV and Covid-19 research. With a PhD in biotechnology and multidisciplinary experience that includes molecular biology, programming and data science, Anjali is well equipped to tackle complex problems at the intersection of science and technology. She is motivated to solve real-world problem by combining basic research with modern data driven technologies in a collaborative and goal oriented environment.
MLOps in Databricks: A Case Study to Detect Anomalies in Clinical Trial Data
Session - anjali aggarwal
To develop machine learning products efficiently and successfully, MLOps (machine learning operation) has become an important tool in data science team. MLOps manage code, data, and model by combining DevOps, DataOps and ModelOps. In this session, I’ll show you how we can process all the stages of MLOps from development to production using databricks platform and will explore its capability to automate, schedule and even use custom pretrained models to run an entire machine learning pipeline. To demonstrate databricks MLOps, I’ll be using clinical trial data to build a patient anomaly detection pipeline.
Kaitlyn Petronglo
advanced analytics manager - logic20/20
Kaitlyn Petronglo is a Manager at Logic20/20 where she helps clients maximize their investment in machine learning and advanced analytics. Kaitlyn has over nine years of experience as a project manager, scrum leader, and data analytics consultant. She is passionate about using data to solve critical problems and enjoys coaching high-velocity teams using agile techniques. Kaitlyn is a certified Project Management Professional (PMP) and Certified Scrum Master (CSM). She also holds a bachelors in English Literature from The Catholic University of America and a certificate in machine learning methods from the University of California San Diego.
From Desktop to Production - Scaling Data Science within the Enterprise
Session - kaitlyn petronglo
Data science is unique in its positioning at the intersection of art and science, which makes it an attractive career path for creative, analytical individuals who like solving complicated problems. But how does a talented data science team go from creating scrappy data science projects on their laptops to running scalable applications that can meet business needs and deadlines? In this talk, I will explore how MLOPs can introduce key technologies, skillsets, and principles that unite data science with software development practices and make data science products useable within the enterprise.
Briefly, here's an outline of my talk:
Desktop data science - the common starting point for model development
How to mature practices and identify meaningful investments
Going production - why and when its necessary
How to manage data, models, and decisions using MLOps; a few examples
Catherine Nelson
principal data scientist - SAP concur
Catherine Nelson is a Principal Data Scientist at SAP Concur, where she explores innovative ways to deliver production machine learning applications which improve a business traveler’s experience. Her key focus areas range from ML explainability and model analysis to privacy-preserving ML. She is also co-author of the O'Reilly publication “Building Machine Learning Pipelines", and she is an organizer for Seattle PyLadies, supporting women who code in Python. In her previous career as a geophysicist she studied ancient volcanoes and explored for oil in Greenland. Catherine has a PhD in geophysics from Durham University and a Masters of Earth Sciences from Oxford University.
How to Write Good Data Science Code
Session - catherine nelson
Whenever we're doing data science, we're writing code. Although most of us didn't start out as software engineers, we've picked up the fundamentals and we can get the job done. But many of us would like to improve our skills and learn to write code that can scale up to larger production systems. In this talk, I’ll share what I’ve learned from the world of software engineering that can be applied to data science. I’ll describe how to write code that is efficient, readable, modular, simple and robust. I’ll explain what each of these principles mean, how to apply them to the code you’re writing, and I’ll illustrate this with examples drawn from popular Python packages including pandas, Numpy and scikit-learn. You’ll learn skills that will help you work effectively on a larger codebase, and how to write Python code that will run efficiently in production.
Subhadra Vadlamannati
student, nonprofit founder
Subha is the founder of Linguistics Justice League, a 501(c)3 nonprofit organization, and a board member of Young Nonprofit Professionals Network (YNPN) and Youth Board Member of Invest in Youth. Subha’s work at the intersection of Data Science, NLP, ML and Community Service led to a Society of Women Engineers Next (SWE) STEM in Action award, National Center for Women and Technology Aspire and Impact award, a publication in the Journal of Student Research, and a TEDx talk. Her work was featured in Geekwire and she was recognized by Puget Sound Business Journal’s “Seattle Inno Under 25”. Many languages that refugees and local Native American tribes speak are considered “low-resource” languages that are underrepresented in the media. Her nonprofit organization’s mission is to build fun and engaging bilingual educational content and apps for language learners who speak these languages by leveraging Natural Language Processing, Machine Learning and Gamification. Subha has dedicated herself to this effort and helping non-native English speakers preserve their own language and cultural heritage, promoting multilingualism nationwide.
The Gender Disparity of Refugee Earnings in the United States
Session - subhadra vadlamannati
The refugee crisis impacts both low and high-income countries alike, and the question of refugee assimilation receives much attention worldwide. While all refugees face various challenges in assimilating to their host countries, female refugees face additional challenges. My talk leverages Data Science techniques to study the earnings of refugees upon arrival to their host countries. I used the 2018 Annual Survey of Refugees to study the earnings trajectory of male and female refugees who arrive in the United States. From analyzing this data I found that gender (p <0.001) and years of schooling (p< 0.05) are the most significant variables impacting pay. Surprisingly, none of the other variables including proficiency in English, Age and University degree seem to have a statistically significant impact. Using linear regression models to study the differences in male and female refugee pay reveals a significant earnings gap of approximately $1.70 an hour, which is equivalent in pay to female refugees receiving almost eight more years of schooling.
To examine the underlying mechanism behind this result, I studied how the predicted earnings trajectory varies when including the UNDP Human Development Index and the World Economic Forum Global Gender Gap variable, using refugees’ country of birth. My findings indicate robust results that female refugees do not benefit from increases in human development, while both male and female refugees benefit from increases in gender equality. These results have important implications for refugee policy in the form of cash assistance or vocational training.
The output of this research led me to dive deeper into aspects that impact refugee assimilation in the US. The second part of the presentation focuses on this project.
A key contributor to refugee success in the US is the level of education they can achieve despite the large language barrier. It is scientifically proven that leveraging a person’s strength in their native language accelerates their learning of another language as well as other concepts such as STEM. Unfortunately, for speakers of marginalized languages and dialects, it is a challenge to find bilingual content in their native language to help them learn English. I therefore embarked on building a mobile library app that uses Machine learning techniques to translate children's books from English to the learner's native language to generate a bilingual book in real time. The presentation will provide insights into the challenges of applying ML techniques such as OCR and machine translation during this project.
Kaylea Champion
PhD Candidate in Communication - UNIVERSITY of WASHINGTON
Kaylea Champion is a PhD Candidate in Communication at University of Washington. She studies how people cooperate online to build software and knowledge, including what gets written and maintained (and what doesn't), who participates (and who is excluded), and how organizations get built (or fall apart). Prior to grad uate school, she was an IT director and consultant.
Let’s Re-think Political Bias & Build Our Own Classifier
workshop - kaylea champion
How can we think about political bias without falling into assumptions about who's on what side and what that means? Data science and ML offer us an alternative: we can parse political speech about a topic and use NLP/ML techniques to classify articles we scrape from the web. In this hands-on workshop, we'll parse the Congressional Record, build a classifier, scrape search results, and analyze texts. You'll walk away with your own example of how to use data science to analyze political framing.
Robin Hackett
advanced analytics manager - logic20/20
As an Advanced Analytics Manager, Robin has 10+ years of experience leading data-driven initiatives in both government and commercial contracting industries. She excels in leveraging statistical models and machine learning algorithms to deliver meaningful insights that drive business growth. With a passion for continuous learning, Robin stays up to date with the latest trends in data analytics to ensure her team delivers impactful solutions.
How Machine Learning Operations (MLOps) is Changing the Data Science Landscape
Session - robin hackett
This 20-minute WiDS talk aims to provide a comprehensive but high-level overview of the following:
1) A brief history of the data science landscape leading to the introduction of MLOps
2) A description of MLOps and its benefits to include how MLOps processes address industry demand through scalability
3) Commonly used MLOps cloud-based platforms and why these platforms are a more cost-effective and efficient method
4) Common implementation challenges
5) Use cases and industry examples of successful MLOps deployment
6) A description of general skill sets needed on MLOps teams
Melly Beechwood
machine learning engineer - axon
Melly is a Machine Learning Engineer at Axon where she has a wonderful opportunity to help save lives, and is currently studying her Master’s in Computer Science with a specialisation in Artificial Intelligence. She is passionate about using ML to help improve animal welfare and has experience as an amateur animal trainer. In her free time, Melly enjoys spending time with her horse, two cats, reading classic books, and fibre arts (weaving & knitting).
Exploring Knowledge Graphs for the Preservation of Orcas in the Pacific Northwest
Session - melly beechwood
The Pacific Northwest is home to a diversity of animal species, including the iconic orca, however increasing threats are making it difficult for these animals to survive. In order to properly address these threats, it is essential that policy makers have an accurate and comprehensive understanding of the species and its environment. A knowledge graph can provide an effective platform to combine the research from disparate sources – from biologists to local citizens – and create an overall view of the situation. This talk will explore the use of a knowledge graph to inform policy decisions, from the collection of citizen observations to natural language processing, to the global insights that could be gleaned from a well-constructed knowledge graph. By providing an overview of this powerful tool, this talk will help demonstrate how knowledge graphs could be used to help mitigate the decline of orcas in the Pacific Northwest.
Sophia Yang, PhD
senior data scientist - anaconda
Sophia Yang is a Senior Data Scientist and a Developer Advocate at Anaconda. She is passionate about the data science community and the Python open-source community. She is the author of multiple Python open-source libraries such as condastats, cranlogs, PyPowerUp, intake-stripe, and intake-salesforce. She serves on the Steering Committee and the Code of Conduct Committee of the Python open-source visualization system HoloViz. She also volunteers at NumFOCUS, PyData, and SciPy conferences. She holds an M.S. in Computer Science, an M.S. in Statistics, and a Ph.D. in Educational Psychology from The University of Texas at Austin.
PyScript for Data Science
Session - sophia yang
Are you a data scientist or a developer who mostly uses Python? Are you jealous of developers who write Javascript code and build fancy websites in a browser? How nice would it be if we can write websites in Python? PyScript makes it possible! The open-source tool PyScript allows users to write Python in the browser. In this talk, I will introduce PyScript and discuss what does PyScript mean for data scientists, how PyScript might change the way data scientists work, and how PyScript can be incorporated into the data science workflow.
Dana Lindquist, PhD
sr. technical program manager - nordstrom
Dana discovered data science about 4 years ago while working as a project manager at a company that had a great deal of data. Her career had trended away from numerical methods where she received a PhD some years ago. To get more involved with data science she enrolled in the Metis Data Science Bootcamp after which she worked as a data scientist for 3 years. She recently joined Nordstrom as a Sr. Technical Program Manager for a data science team, pulling together much of her past experience.
Janet Carson
SR. Data Engineer - EcHOdyne
Janet Carson is a Senior Data Engineer at Echodyne in Kirkland, where she builds software systems to process radar sensor data for engineering research and development. Before joining Echodyne in 2019, she was a stay at home mom for 20 years, and before that she was a software developer. She has a BA in Applied Math, an MS in Computer Science, and a bootcamp certificate in Data Science. In addition to the bootcamp, the Women in Data Science meetups and interview prep group were part of her return to the workforce. She is looking forward to giving back in a small way by speaking on this panel.
Anjali Aggarwal, PhD
Data Scientist - seagen
Anjali is a data scientist at Seagen, a biotech pharma company dedicated to discovering, developing and commercializing transformative cancer medicines to make a meaningful difference in people's lives. At Seagen, Anjali is focused in developing end-to-end machine and deep learning capabilities for cancer therapeutics with the goal of bringing these therapies to patients faster. Prior to joining Seagen, Anjali worked as a python developer at Fred Hutch, building data pipelines for HIV and Covid-19 research. With a PhD in biotechnology and multidisciplinary experience that includes molecular biology, programming and data science, Anjali is well equipped to tackle complex problems at the intersection of science and technology. She is motivated to solve real-world problem by combining basic research with modern data driven technologies in a collaborative and goal oriented environment.
Louisa Reilly
CYBER SECURITY CONSULTANT - DELOITTE
Louisa is a Cyber Security Consultant at Deloitte, where she likes to leverage her data science skills to mitigate risk and problem solve. Her career interests include ML, NLP, data visualizations, and data engineering. She earned her Master's of Science in Chemistry at the University of Washington, where she fell in love with data science from an NLP project. In her free time, she enjoys gardening, yoga, and walking her dog.
Let's Take a Break: Gaps in Employment as Women in Data Science
PANEL - dana lindquist, Janet Carson & anjali aggarwal; MODERATOR - LOUISA REILLY
Let’s take a break! People leave and reenter the workforce for a variety of reasons: job loss, childcare, career change, upskilling, etc. However, women are more likely to have gaps in employment. Plus, their reported gaps tend to be for longer periods of time! Returning to work after a break is often a daunting task, and a lot of preparation is needed to land a job. Even after receiving/ accepting a job offer, there will be a transition period after starting the new job, which can be isolating. For this panel, we brought in three women data professionals with a variety of gaps in employment from maternity leave to 2-3 of years to 20 years. They will talk about their experiences and offer suggestions for others who are reentering the workforce, thinking about taking a break, or in the middle of their break. They will also be answering questions from the audience which will be facilitated by a moderator.
Victoria Hunt, PhD
director of data solutions - crosswalk labs
Victoria Hunt is Director of Data Solutions at Crosswalk Labs. In this role, she performs analyses on emissions data to turn that data into useful insights for cities and local governments. Previously, as a Data Scientist for Breakthrough Energy, Victoria researched and implemented simulation and analysis methods for the Breakthrough Energy team’s US grid simulation framework. She is keenly interested in policy, and in supporting climate action though data visualization and data storytelling. Victoria’s passion for policy is also reflected in her pursuits outside of her role as Director of Data Solutions; she currently is a city councilmember for the city of Issaquah, and in this role serves on several regional boards and commissions.
Web Maps 101 : Put Your Story on the Map!
Session - victoria hunt
‘Story maps’ are on the rise, and with good reason; this powerful data visualization technique combines interactive and engaging web maps with compelling narratives to tell stories with data in a clear and memorable way. When you leave my talk, you’ll have all the info you need to make your own interactive story maps and web maps that work on desktop and mobile, and that provide the user with an engaging experience and usable insights. I work for a startup that provides cities with greenhouse gas emissions data, and I specialize in making maps that distill millions of data points into usable insights that local governments can use to meet their climate action goals; I’ll walk through how I do that step by step. Specifically, I’ll demonstrate how I use QGIS to create web maps of greenhouse gas emissions for cities and counties. We will also discuss important digital accessibility considerations for web maps and story maps.
Akriti Chadda
applied scientist - microsoft
Akriti is an accomplished applied scientist with a strong focus on search and relevance. She possesses a diverse skill set, having earned an undergraduate degree in biomedical engineering and a master's in computer science. Her expertise lies in developing advanced algorithms for search engines, and she constantly strives to deliver exceptional results. In her free time, she can often be found engrossed in memoirs and biographies, fascinated by the stories of people's lives and the lessons they offer. She also has a love of lo-fi music and to keep herself energized, she relies heavily on her love of coffee, which she consumes in copious amounts.
Improving Relevance in Search: Techniques for Inference and Ranking
Session - Akriti chadda
In today's world, search engines play a vital role in helping us find the information we need quickly and accurately. However, as the volume of available information continues to grow, it becomes increasingly challenging for search engines to deliver relevant and accurate results. In this talk, we'll delve into the techniques that search engines use to improve the relevance of their search results.
We'll start by discussing the basics of search engine architecture, including how search engines crawl and index the web and how they process and rank search queries. We'll cover key concepts such as web crawling, indexing, and ranking algorithms, as well as the role of user behavior data in search engine ranking.
Next, we'll explore the use of inference and machine learning techniques to improve relevance. We'll discuss the use of natural language processing (NLP) to understand the intent behind search queries, as well as the use of recommendation algorithms to deliver personalized search results. We'll also cover the role of user behavior data in improving relevance, including techniques such as collaborative filtering and matrix factorization.
By the end of this talk, you'll have a solid understanding of the approaches that search engines use to deliver relevant and accurate search results. You'll also have a better understanding of the challenges and opportunities that exist in the field of search and relevance, and how you can apply these techniques to your own work. Whether you're a beginner or an experienced practitioner, you'll come away with a wealth of knowledge and ideas for improving the relevance of search results in your own projects.
Apurvaa Subramaniam
Senior Data Scientist - instacart
Apurvaa is a Senior Data Scientist on the ads team at Instacart. Prior to Instacart, she was at Amazon where she worked in multiple teams on a variety of data science/analytics problems such as experiment design, predictive modeling and causal inference. She has a Masters in Analytics from Northwestern University and a Bachelors in Computer Engineering from Nanyang Technological University, Singapore.
Accelerating Experiment Design: Beyond A/B Testing
Session - apurvaA subramaniam
In the past few years, according to a new McKinsey Global Survey of executives, companies have accelerated the digitization of their customer and supply-chain interactions and of their internal operations by three to four years, and the share of digital or digitally enabled products in their portfolios has accelerated by seven years.
As a result, more companies are adopting Online Controlled Experiments to estimate the impact of business innovations and enable data-driven decision making at scale. Fixed horizon A/B testing is the go-to experiment design in industry, and it works well in a lot of scenarios. However, in cases such as multiple test variants, low traffic, high variance population, etc, optimizing traditional A/B testing as well as using other experiment designs can help accelerate the experimentation process and thus enable faster decision making.
In this talk, I will give an overview of a few different techniques for making experimentation faster:
1. Optimal Triggering
2. Variance Reduction
3. Sequential Testing
4. Multi-Armed Bandit
I will give examples of when to consider using these techniques, how to get started, pros and cons, and resources for further reading. This talk will help attendees who are familiar with A/B testing expand their experimentation design toolkit.
Juilee Bhosale
SR. DATA scientist - zillow GROUP
Juilee is Sr Data Scientist at Zillow group supporting the Premier Agent marketing team. Before Zillow, Juilee graduated with a masters degree from Purdue and spent a significant chunk of time at Transunion building ML classification & optimization models in risk & fraud. Outside of work Juilee is a passionate advocate for women in tech, and in her free time enjoys teaching kids and young professionals how to code.
A/B Testing Using Propensity Score Matching
Session - juilee bhosale
Control groups are a crucial aspect of experimental research, allowing researchers to compare outcomes of an experimental group to a group that is similar but not exposed to the treatment. However, designing an appropriate control group can be challenging, due to presence of confounding variables that can introduce bias and affect the outcome of the study.
In this talk, I discuss the use of propensity score matching to find statistically comparable groups and mitigate confounder bias in experiments. Propensity score matching is a statistical technique used to control for potential confounding variables in A/B testing, and is particularly useful when comparing groups that are not randomly assigned to receive a treatment or product. We begin by reviewing the basic concepts of propensity scores matching and the statistical techniques to calculate scores and find comparable statistical control using these scores. We also discuss the use of covariate balance measures to assess the quality of the matching and the importance of using multiple rounds of matching to further refine the comparison groups. The talk discusses the advantages of using propensity score matching in experimental design, including the ability to reduce bias and improving attribution of outcomes to treatment in a study and provides examples of how propensity score matching can be implemented in practice. To conclude we walk through the usefulness of this approach through a case study and discuss the potential applications and limitations of propensity score matching in experimental design.
Katherine Ostbye, MPH
Director, Enterprise Data Science and Machine Learning - SEAGEN
Kate Ostbye is the Director of Enterprise Data Science and Machine Learning at Seagen, a global biotechnology company that develops and commercializes transformative cancer therapies, where she leads the strategic investment in AI/ML solutions. She co-leads Seagen’s Data Science community of practice, SeaCode, bringing to light resources and tools for people who solve problems using code; and she also co-leads WIN (Women’s Impact Network), Seagen’s employee resource network focused on leveraging and developing women across the organization. Kate earned her Bachelor of Science in English and Anthropology at the University of Wisconsin, Madison, where she researched neurodegenerative genes in fruit flies, and her Master’s in Public Health focused on Epidemiology and Biostatistics at Johns Hopkins Bloomberg School of Public Health. Her career is centered on improving patients’ lives, spanning academic and industry sponsors, individual contributor to leadership roles, multiple programming languages and applications, and pre-clinical research to late-stage submission trials. She has contributed to PHUSE’s R Package Validation Framework White Paper, CDISC’s HIV Therapeutic Area User Guide v1.0, and the R Consortium’s R Certification Working Group.
10 Ways to Navigate and Enhance Your Next "Unicorn" Data Scientist Application
workshop - katherine ostbye
Data Science is a team sport where varied experiences, trainings and expertise aggregate across individual contributors to innovate and develop solutions. So why is it so hard to articulate what are the Data Scientist roles and responsibilities? Applicants can feel overwhelmed and downright discouraged by job descriptions that scope a broad data science life cycle (e.g. data exploration, data engineering, statistical modelling, and data visualization), expertise across a diverse and evolving data science tech stack, and often times a specialized domain experience relevant to the data of interest. In this workshop I will present 10 strategies that we can apply to decode that job description so that you can apply and interview with confidence.
1. Before you apply, do your homework: List the top skills and responsibilities that you want to learn or leverage in a new role.
2. Now do your extra credit: List the domains, i.e. business or fields of application, that you want to learn or leverage in a new role.
3. Decode the role: Map your goal skills and responsibilities to those presented. Smaller teams with many skills and responsibilities may signal growth opportunities while larger teams with specialist roles may signal advancement in technical skill depth.
4. Decode the domain: Connect your goal domains to the list presented by considering your experience, education and interest.
5. Validate your model: Craft three interview questions that you need answered to determine if there is the right assumed opportunity based on your decoding.
6. Validate your application: Craft three connections that you want to highlight in your application through your resume and/or cover letter.
7. Network for feedback: Leverage your network by crafting an elevator pitch about why you think you're great for this role. List three people whom you can share your pitch with: one who can give you honest but tough feedback, one who can knows your strengths, and one who may know the role.
8. Background Research: What's missing from the job description that is still very important to you? Get early intel on things like benefits and company culture through tools such as Glassdoor and LinkedIn.
9. Understand the Customer: Once you've applied, you'll likely have a chance to find out who is the hiring manage and maybe even who is on the interview panel. Craft questions for each panelist that you can identify.
10. Prep your interview: See the structure, organize your strategy for any technical sessions, and review the STAR method for answering behavioral questions.
Find the right Data Scientist role for YOU by focusing first on what you have to offer and what you want in a next role. Then check your assumptions and call out your capabilities. Leverage your network and tools to gather insights that aren't on the job description. Finally, customize your questions and response style to the format and participants of the interview loop.
Kelley Hall, PhD
Data Scientist - tableau, a salesforce company
Kelley Hall is a Data Scientist at Salesforce working on the Tableau Global Sales Operations team where she uses ML to enable data driven decision making within the sales organization. Her projects range from sales forecasting to discount recommendation. She received her PhD from the University of Washington, focusing on slow slip earthquakes in the Pacific Northwest. In her free time, Kelley coaches Ultimate frisbee for the University of Washington Women’s team and enjoys the outdoors with her pup Gus.
How to Predict The Future: Powering Decision Making Through ML Forecasting
Session - kelley hall
In sales, everyone has their own secret sauce for how they do their business. Especially when it comes to forecasting their sales for a given quarter, leading to siloed information and making it impossible to determine root causes to under or over-forecasting. So how can you use machine learning to demystify the forecasting process and build consistency and confidence in data?
In this talk, I will share my own experience working for in Sales Operations to develop a forecasting model. I will address how to set up a forecasting problem and model (specifically using the GluonTS package developed by AWS), common pitfalls, and how I used data visualization in Tableau to provide actionable insights. Most importantly I'll share how we were able to get non-technical users bought in and confident with our model, making the model a part of their daily routine.
Riya Joshi
data scientist - microsoft
Riya is a Data and Applied Scientist at Microsoft who specializes in NLP and machine learning. She holds a Master’s degree in CS from the University of Massachusetts, Amherst, which she completed in May 2022. Before joining Microsoft’s US team, she worked as a Data Engineer in India. She is passionate about data and AI-driven products and solutions that can benefit people and society. She enjoys hiking, dancing and working out in her spare time.
Understand BERT
Session - riya joshi
For any NLP enthusiast, BERT has been one of the most heard names. Neural language models have changed the face of NLP because of their immense power to understand human language. This talk presents an introduction to what BERT is and how it works. This doesn't just focus on the theory but gives practical tips on how to finetune Bert in various NLP tasks such as:
Question/Answering
Summarization
Text Classification
This talk can be attended by anyone who has basic knowledge of neural network. This is an introductory level talk on the topic
Iswarya Murali
principal data scientist - microsoft
Iswarya Murali is a Principal Data Scientist at Microsoft. She leads data science and machine learning initiatives to empower the business make data-driven decisions, and enable the power of ML and AI in Microsoft's products and processes. She has previously worked at Google in their Risk and Fraud Operations team, and at an early stage analytics startup. She is passionate about growing and mentoring women in data science.
What's Next: Navigating the Career Path to Becoming a Staff/Principal Data Scientist
Session - Iswarya murali
"What got you here won't get you there."
Promotions are tricky. A Staff/Principal role in engineering companies involves broad impact across the organization, strong technical leadership and being a force multiplier in the team. A promotion to this level can be challenging in the Data Science field, which is more specialized and niche compared to SoftwareEngineering, where Principal roles are rarer and not as well-defined. In this talk I want to share my learnings from my own experience about the skills needed to be an effective Staff/Principal DataScientist – about how to create exponential impact across the organization instead of doing more of the same work, finding your niche, developing technical and business acumen, communicating effectively at the leadership level, and most importantly, advocating for yourself.
Vanshika Jain
product manager II - microsoft
Vanshika Jain is a Data Science Product Manager at Microsoft. In her role, she works on developing data products for the Azure Support and Reliability teams. Prior to joining Microsoft, Vanshika worked with Amazon Fashion Tech where she launched a Made to Measure platform that extracts body measurements from customer images and delivers a tailored-made T-shirt. Vanshika came to Seattle from India to pursue her Masters degree from the Foster School of Business at the University of Washington in Seattle. In my free time, I enjoy all things family, food, traveling, and fashion.
Data Science in Product Management
SESSION - Vanshika jain
A data PM is a PM who owns data products, not a PM who has to be a data scientist or data engineer on a product team. The talk will be focused on answering key questions surrounding job role of data product manager such as:
- Why and how has this role become increasingly important?
- Differences between job role and responsibilities tradition product manager and data product manager
- Traditional product lifecycle vs data product lifecycle
- How can you elevate one’s skills to become data product managers?
- What are the challenges that data PM’s face today with real world examples?
Sanghamitra Deb, PhD
staff data scientist - chegg inc
Sanghamitra Deb is a Staff Data Scientist at Chegg, she works on problems related school and college education to sustain and improve the learning process. Her work involves recommendation systems, computer vision, graph modeling, deep NLP analysis , data pipelines and machine learning. Previously, Sanghamitra was a data scientist at a Accenture where she worked on a wide variety of problems related data modeling, architecture and visual story telling. She is an avid fan of python and has been programming for more than a decade. Trained as an astrophysicist (she holds a PhD in physics) she uses her analytical mind to not only work in a range of domains such as: education, healthcare and recruitment but also in her leadership style. She mentors junior data scientists at her current organization and coaches students from various field to transition into Data Science. Sanghamitra enjoys addressing technical and non-technical audiences at conferences and encourages women into joining tech careers. She is passionate about diversity and has organized Women In Data Science meetups.
Using Multi-Modal Data Sources to Model Predictive Outcome
Workshop - sanghamitra deb
In the past decade, Machine Learning has touched different aspects of our life such as education, healthcare, social network, entertainment, e-commerce and so on. Most tech companies collect huge quantities of data on content, customers, products and their interactions, to mention a few. In many applications, input signals come with multiple modalities - there could be text, images, video, audio, etc. Ideally, a predictive model should be able to leverage all these modalities, together with other structured data to come up with rich representations that ultimately power meaningful consumer experiences. It is possible to have image, speech, text and structured data that can be used to create a predictive solution such as content quality, churn, search or recommendations.
In this tutorial I will present a deep learning framework where multiple modes of data is used as input for a specific predictive task. For text data, embeddings from language models are used as initial layers followed by CNN, LSTM or transformers. Information from images are extracted in the form of embeddings, and concatenated with text data to enhance predictive features. Once all the data are combined there is a final classification layer for the predictive outcome. In some cases there can also be audio (podcasts, recorded presentations, voice components for videos) or video data (movies, educational videos, videos for ads). This information can also be added to the feature space of predictive models. Once all the data are combined there is a final classification layer for the predictive outcome.
In this tutorial I will discuss building a generalized multi-modal predictive model.


